Navigating the Inflation Reduction Act
What energy efficiency businesses need to know.
BPA’s latest achievement is helping to secure billions of dollars in rebates and incentives for home energy efficiency and electrification, plus hundreds of millions of dollars to train workers for the jobs that funding will create by helping shape the 2022 Inflation Reduction Act (IRA).
State Energy Offices – Click Here to See How BPA is Supporting States ›
Important Documents & Resources
Jump to:BPA Fact Sheet for Energy Efficiency Businesses
State Allocations for Home Energy Rebate Program | Training Residential Contractors Grants | IRA Resource Library
What’s in the IRA for Home Performance Contractors & Consumers?
Homes Energy Performance Based, Whole House Rebates (HOMES)Total Funding: $4.3 billion
(available through September 2031 or until expended)
State Energy Offices will set up new Home Energy Performance-Based, Whole-House (HOMES) Rebate Programs.
- Rebates are doubled for low- and moderate-income individuals making less than 80 percent of Area Median Income.
- Contractors providing retrofits under HOMES state programs can also claim a $200 rebate per home serviced in an underserved community.
- IRA prohibits combining HOMES rebates with any other Federal grant or rebate – including the new High-Efficiency Electric Home Rebate Program.
- IRA does not prohibit combining HOMES rebates with state/utility rebate programs.
- IRA does not prohibit combining HOMES rebates with federal tax credits like 25C (Energy Efficient Home Improvement Credit).
- HOMES rebate programs will feature an array of tiered incentives for consumers based on two different pathways to home performance: modeled energy savings and measured energy savings.
HOMES Tiered Incentive Pathways
HOMES rebate programs will feature an array of tiered incentives for consumers based on two different pathways to home performance: modeled energy savings and measured energy savings.
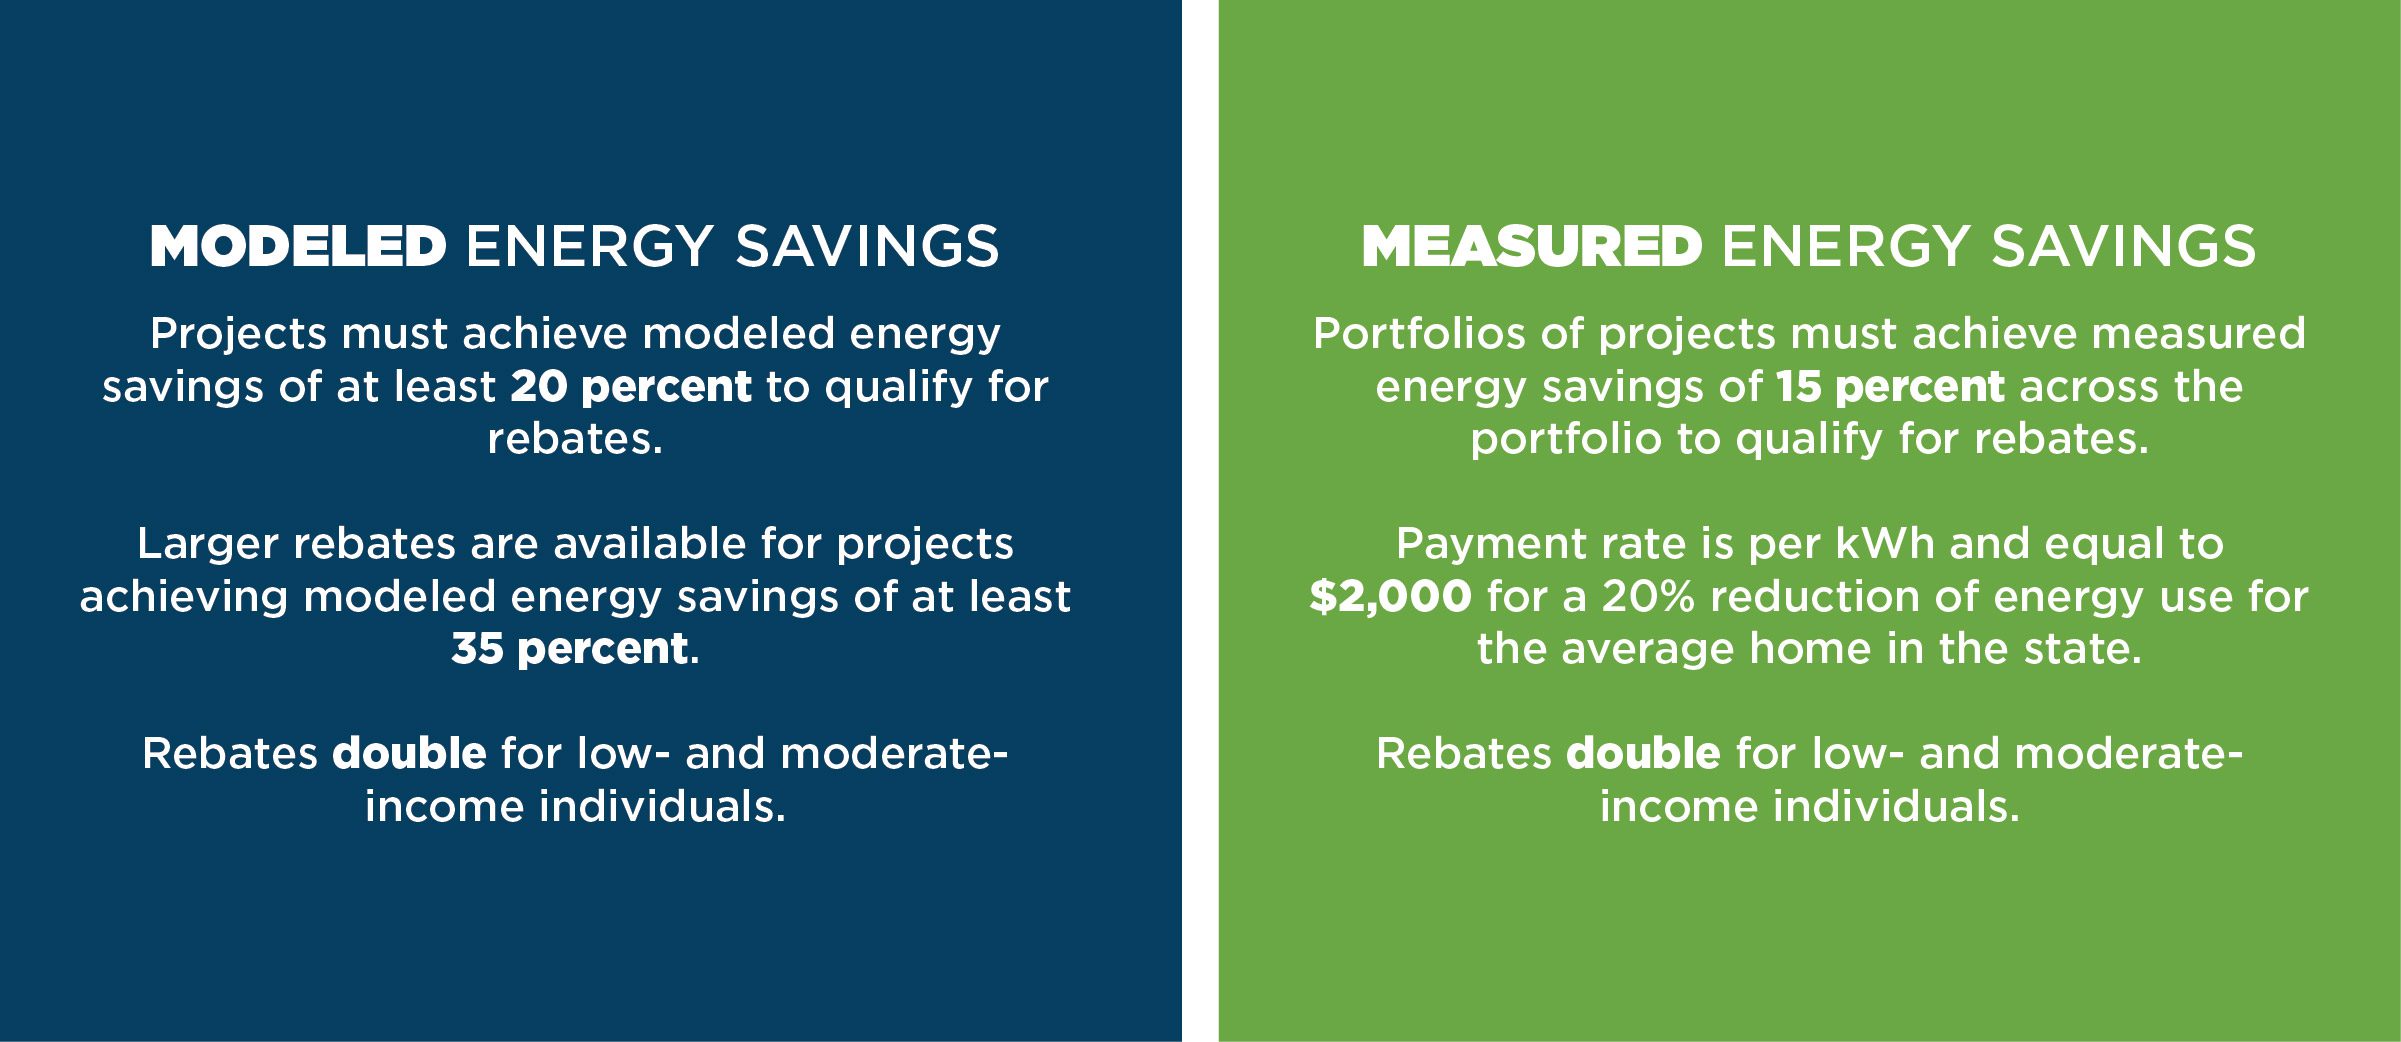
Modeled Energy Savings Pathway
Projects using the modeled energy savings pathway must be calibrated to historical energy usage for a home consistent with BPI 2400. DOE guidelines will provide more details.
Energy Savings |
Single-Family |
Multifamily |
|---|---|---|
| 20-35 Percent |
$2,000 or 50% of the project cost (whichever is less). For low- and moderate-income (LMI) individuals, $4,000 or 80% of the project cost (whichever is less). |
$2,000 per dwelling unit, with a maximum of $200,000 per multifamily building. |
| Over 35 Percent | $4,000 or 50% of the project cost (whichever is less). For LMI individuals, $8,000 or 80% of the project cost (whichever is less). | $4,000 per dwelling unit, with a maximum of $400,000 per multifamily building. |
Measured Energy Savings Pathway
Projects using the measured energy savings pathway must use open-source advanced measurement and verification software, as approved by DOE, to determine and document monthly and hourly (if available) weather-normalized home energy use, both before and after home efficiency retrofits. DOE guidelines will provide more details.
Energy Savings |
Single-Family & Multifamily |
|---|---|
| Over 15 Percent |
$2,000 payment rate per kilowatt hour saved equal to a 20% reduction for the average home in the state, or 50% of project cost. For LMI individuals, $4,000 payment rate per kilowatt hour saved equal to a 20% reduction per home or dwelling unit, or 80% of project cost. For multifamily buildings to qualify, at least 50% of residents must be LMI. Energy baselines are calculated based on the average energy use of single-family homes or multifamily buildings in the State. |
Total Funding: $4.5 billion
(available through September 2031 or until expended)
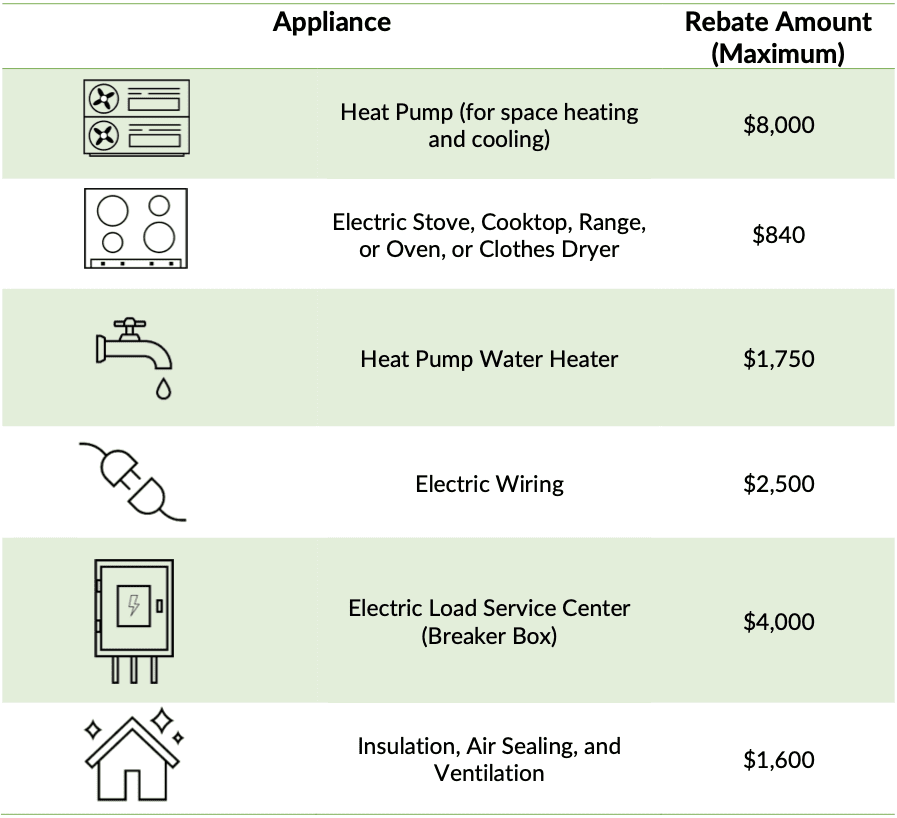
State Energy Offices will set up new Home Electrification and Appliance Rebate (HEAR) programs. These programs will provide point-of-sale rebates for electric appliances for exclusively low- and moderate-income households. Rebates cannot be combined with HOMES rebates, but IRA does not prohibit combining rebates with federal tax credits and state/utility rebates.
- Rebates are capped at $14,000 total per recipient.
- For households with less than 80% Area Median Income, 100% of costs are covered. For households with between 80-150% Area Median Income, 50% of costs are covered.
- $225 million is reserved for tribal communities.
Total Funding: $200 million
DEADLINE TO APPLY: JAN. 31, 2024
(available through September 2031 or until expended)
State Energy Offices can now apply for *$150 million in funding from the Training Residential Energy Contractors Grants (formally Contractor Training Grants) to develop and implement programs to support training home energy efficiency and electrification contractors. The Administrative and Legal Requirements Document (ALRD) provides guidance to State Energy Offices on the application process for formula funding.
Eligible Uses of Funds
- Reduce the cost of training contractor employees.
- Provide testing and certification of contractors.
- Partner with nonprofit organizations to develop and implement grants.
*$200,000,000 total, including $150,000,000 to be distributed to states through a formula in two installments, and up to $40,000,000 to be distributed to states through a competitive process. Details on the competitive process have not yet been announced.
Energy Efficient Home Improvement Tax Credit (25C)The Inflation Reduction Act of 2022 (H.R. 5376) extends the Energy Efficient Home Improvement Credit (25C) through the end of 2032 and expands the credit to allow households to deduct 30% of the costs of eligible upgrades from their taxes while adding new qualified products and larger dollar maximums. IRA also eliminates the credit’s lifetime cap and makes 25C an annual credit, meaning eligible taxpayers can claim it every year for new improvements (but cannot carry the credit forward to future years).
- 25C is available now for qualifying upgrades placed in service on or after January 1, 2023. Consumers claim the credits when filling out their tax returns via IRS Form 5695, including any relevant product receipts.
- 25C expands the credit to allow households to deduct 30% of the costs of eligible upgrades from their taxes while adding new qualified products and larger dollar maximums.
- Up to $600 per item: breaker panel, insulation, fossil fuel systems (meeting elevated efficiency limits) with maximum of $1,200 tax credit.
- Heat pump water heaters, air source heat pumps, biomass stoves and boilers have a separate yearly credit limit of $2,000.
- In a single year, taxpayers may claim up to $3,200 in tax credits for combined upgrades, provided costs fall under each sub-limit.
- Can be claimed annually through 2032
- IRS Factsheet
- Home Energy Auditor Qualified Certification Programs
Click here to download our 25C tax credit fact sheet.
Inflation Reduction Act Updates
Inflation Reduction Act Resources

More Resources Available with BPA Membership
BPA members have access to even more benefits that will help them navigate the IRA. Join today for instant access to our IRA webinar series recordings and upcoming events.
Join as a Member ›Your State Allocations for Home Energy Rebate Program
This information is from the U.S. Department of Energy.
| Alaska | $37,368,480 | $37,150,940 | $74,519,420 |
| Alabama | $73,032,210 | $72,607,220 | $145,639,430 |
| Arkansas | $52,739,720 | $52,433,010 | $105,172,730 |
| American Samoa | $25,069,710 | $24,923,740 | $49,993,450 |
| Arizona | $76,868,720 | $76,421,080 | $153,289,800 |
| California | $291,951,040 | $290,252,580 | $582,203,620 |
| Colorado | $70,395,350 | $69,985,890 | $140,381,240 |
| Connecticut | $49,830,560 | $49,541,390 | $99,371,950 |
| District of Columbia | $29,808,850 | $29,635,400 | $59,444,250 |
| Delaware | $33,029,650 | $32,837,400 | $65,867,050 |
| Florida | $173,668,720 | $172,657,670 | $346,326,390 |
| Georgia | $109,817,290 | $109,178,020 | $218,995,310 |
| Guam | $25,815,420 | $25,665,110 | $51,480,530 |
| Hawaii | $34,293,520 | $34,093,900 | $68,387,420 |
| Iowa | $60,827,450 | $60,473,810 | $121,301,260 |
| Idaho | $40,604,320 | $40,367,910 | $80,972,230 |
| Illinois | $132,219,190 | $131,452,470 | $263,671,660 |
| Indiana | $91,302,840 | $90,772,430 | $182,075,270 |
| Kansas | $52,971,870 | $52,663,910 | $105,635,780 |
| Kentucky | $67,319,140 | $66,927,750 | $134,246,890 |
| Louisiana | $106,593,900 | $105,972,960 | $212,566,860 |
| Massachusetts | $73,233,910 | $72,809,130 | $146,043,040 |
| Maryland | $68,611,060 | $68,212,540 | $136,823,600 |
| Maine | $35,936,920 | $35,728,050 | $71,664,970 |
| Michigan | $105,904,990 | $105,291,160 | $211,196,150 |
| Minnesota | $74,459,590 | $74,027,440 | $148,487,030 |
| Missouri | $75,807,060 | $75,366,640 | $151,173,700 |
| Northern Marianas | $24,984,780 | $24,839,290 | $49,824,070 |
| Mississippi | $52,543,050 | $52,237,320 | $104,780,370 |
| Montana | $35,692,560 | $35,484,830 | $71,177,390 |
| North Carolina | $104,918,280 | $104,307,840 | $209,226,120 |
| North Dakota | $37,338,470 | $37,121,060 | $74,459,530 |
| Nebraska | $45,813,680 | $45,547,120 | $91,360,800 |
| New Hampshire | $34,952,780 | $34,749,580 | $69,702,360 |
| New Jersey | $91,840,040 | $91,307,380 | $183,147,420 |
| New Mexico | $43,999,070 | $43,742,970 | $87,742,040 |
| Nevada | $48,200,980 | $47,920,160 | $96,121,140 |
| New York | $159,338,380 | $158,415,850 | $317,754,230 |
| Ohio | $124,875,180 | $124,150,970 | $249,026,150 |
| Oklahoma | $64,764,840 | $64,388,040 | $129,152,880 |
| Oregon | $57,046,250 | $56,714,440 | $113,760,690 |
| Pennsylvania | $129,980,360 | $129,226,380 | $259,206,740 |
| Puerto Rico | $42,698,980 | $42,451,090 | $85,150,070 |
| Rhode Island | $32,006,100 | $31,820,030 | $63,826,130 |
| South Carolina | $68,852,430 | $68,451,650 | $137,304,080 |
| South Dakota | $34,379,110 | $34,178,990 | $68,558,100 |
| Tennessee | $ 83,877,940 | $83,390,060 | $167,268,000 |
| Texas | $346,022,980 | $344,006,590 | $690,029,570 |
| Utah | $50,698,180 | $50,403,030 | $101,101,210 |
| Virginia | $94,537,110 | $93,987,430 | $188,524,540 |
| U.S. Virgin Islands | $25,660,980 | $25,511,580 | $51,172,560 |
| Vermont | $29,362,920 | $29,192,160 | $58,555,080 |
| Washington | $83,266,580 | $82,782,050 | $166,048,630 |
| Wisconsin | $74,904,830 | $74,470,200 | $149,375,030 |
| West Virginia | $44,275,290 | $44,017,970 | $88,293,260 |
| Wyoming | $34,686,390 | $34,484,390 | $69,170,780 |
Training Residential Contractors Grants
This information is from the U.S. Department of Energy.
| Alabama | $2,562,900 | $1,281,450 | $1,281,450 |
| Alaska | $1,296,870 | $648,435 | $648,435 |
| American Samoa | $864,460 | $432,230 | $432,230 |
| Arizona | $2,642,230 | $1,321,115 | $1,321,115 |
| Arkansas | $1,881,690 | $940,845 | $940,845 |
| California | $10,321,930 | $5,160,965 | $5,160,965 |
| Colorado | $2,501,170 | $1,250,585 | $1,250,585 |
| Connecticut | $1,881,620 | $940,810 | $940,810 |
| Delaware | $1,151,040 | $575,520 | $575,520 |
| District of Columbia | $1,048,490 | $524,245 | $524,245 |
| Florida | $6,021,760 | $3,010,880 | $3,010,880 |
| Georgia | $3,816,060 | $1,908,030 | $1,908,030 |
| Guam | $891,700 | $445,850 | $445,850 |
| Hawaii | $1,194,820 | $597,410 | $597,410 |
| Idaho | $1,403,750 | $701,875 | $701,875 |
| Illinois | $5,086,340 | $2,543,170 | $2,543,170 |
| Indiana | $3,354,110 | $1,677,055 | $1,677,055 |
| Iowa | $2,188,600 | $1,094,300 | $1,094,300 |
| Kansas | $1,908,060 | $954,030 | $954,030 |
| Kentucky | $2,420,420 | $1,210,210 | $1,210,210 |
| Louisiana | $3,633,890 | $1,816,945 | $1,816,945 |
| Maine | $1,303,340 | $651,670 | $651,670 |
| Maryland | $2,531,970 | $1,265,985 | $1,265,985 |
| Massachusetts | $2,797,870 | $1,398,935 | $1,398,935 |
| Michigan | $4,124,380 | $2,062,190 | $2,062,190 |
| Minnesota | $2,802,670 | $1,401,335 | $1,401,335 |
| Mississippi | $1,848,620 | $924,310 | $924,310 |
| Missouri | $2,779,120 | $1,389,560 | $1,389,560 |
| Montana | $1,248,470 | $624,235 | $624,235 |
| Nebraska | $1,614,510 | $807,255 | $807,255 |
| Nevada | $1,637,710 | $818,855 | $818,855 |
| New Hampshire | $1,259,230 | $629,615 | $629,615 |
| New Jersey | $3,517,680 | $1,758,840 | $1,758,840 |
| New Mexico | $1,533,830 | $766,915 | $766,915 |
| New York | $6,369,300 | $3,184,650 | $3,184,650 |
| North Carolina | $3,698,030 | $1,849,015 | $1,849,015 |
| North Dakota | $1,288,200 | $644,100 | $644,100 |
| Northern Marianas | $860,940 | $430,470 | $430,470 |
| Ohio | $4,791,100 | $2,395,550 | $2,395,550 |
| Oklahoma | $2,286,480 | $1,143,240 | $1,143,240 |
| Oregon | $2,028,480 | $1,014,240 | $1,014,240 |
| Pennsylvania | $4,960,910 | $2,480,455 | $2,480,455 |
| Puerto Rico | $1,594,690 | $797,345 | $797,345 |
| Rhode Island | $1,154,250 | $577,125 | $577,125 |
| South Carolina | $2,397,600 | $1,198,800 | $1,198,800 |
| South Dakota | $1,195,450 | $597,725 | $597,725 |
| Tennessee | $2,980,770 | $1,490,385 | $1,490,385 |
| Texas | $11,674,260 | $5,837,130 | $5,837,130 |
| U.S. Virgin Islands | $889,010 | $444,505 | $444,505 |
| Utah | $1,757,330 | $878,665 | $878,665 |
| Vermont | $1,048,680 | $524,340 | $524,340 |
| Virginia | $3,393,040 | $1,696,520 | $1,696,520 |
| Washington | $2,925,550 | $1,462,775 | $1,462,775 |
| West Virginia | $1,607,110 | $803,555 | $803,555 |
| Wisconsin | $2,835,440 | $1,417,720 | $1,417,720 |
| Wyoming | $1,192,070 | $596,035 | $596,035 |
Stay Updated
Sign up for our mailing list to stay updated on all things home and building performance.
[gravityform id=”1″ title=”false” description=”false” ajax=”true”]By submitting this form, I understand I am subscribing to an email list to receive ongoing communication from BPA.